


-
摘要:
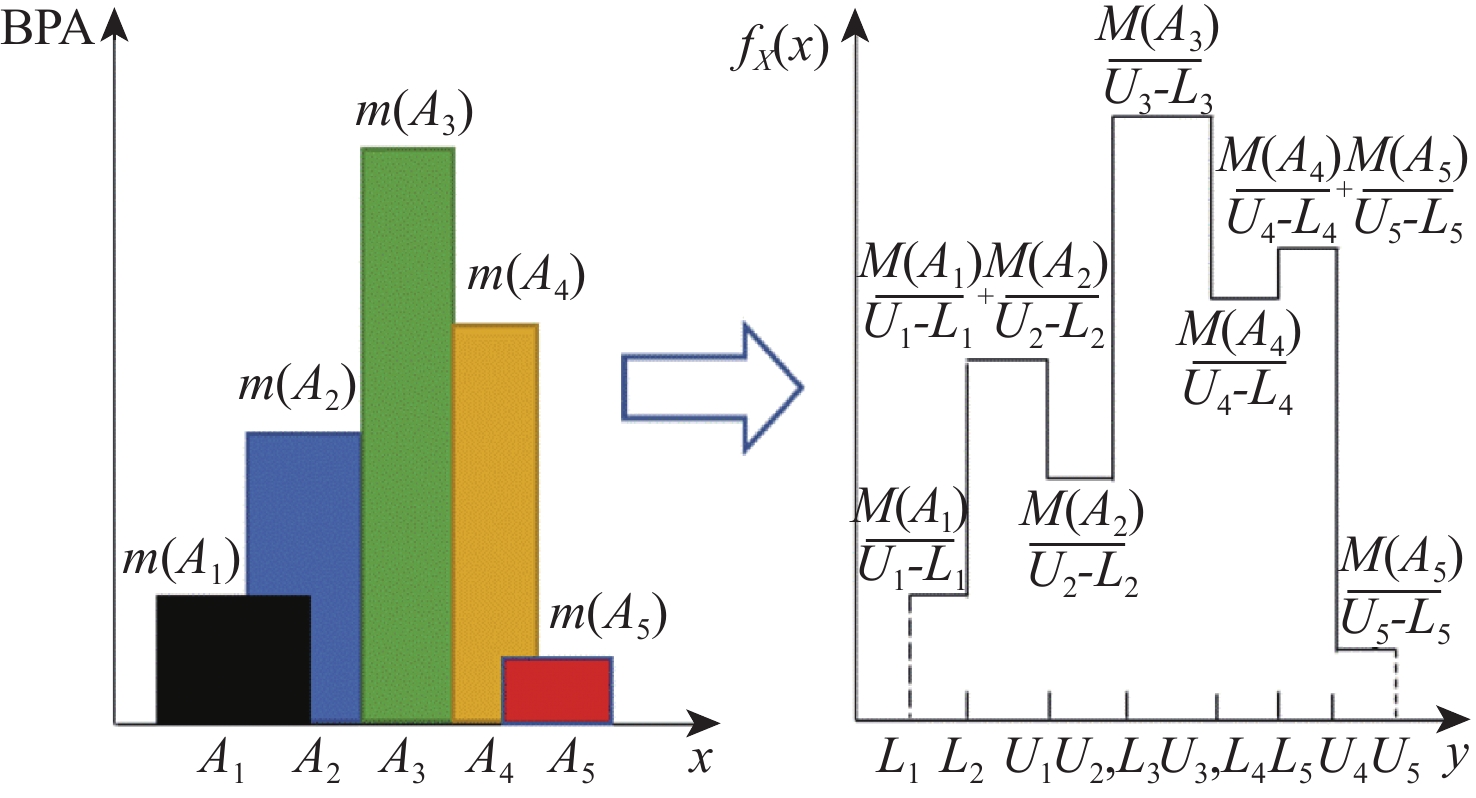
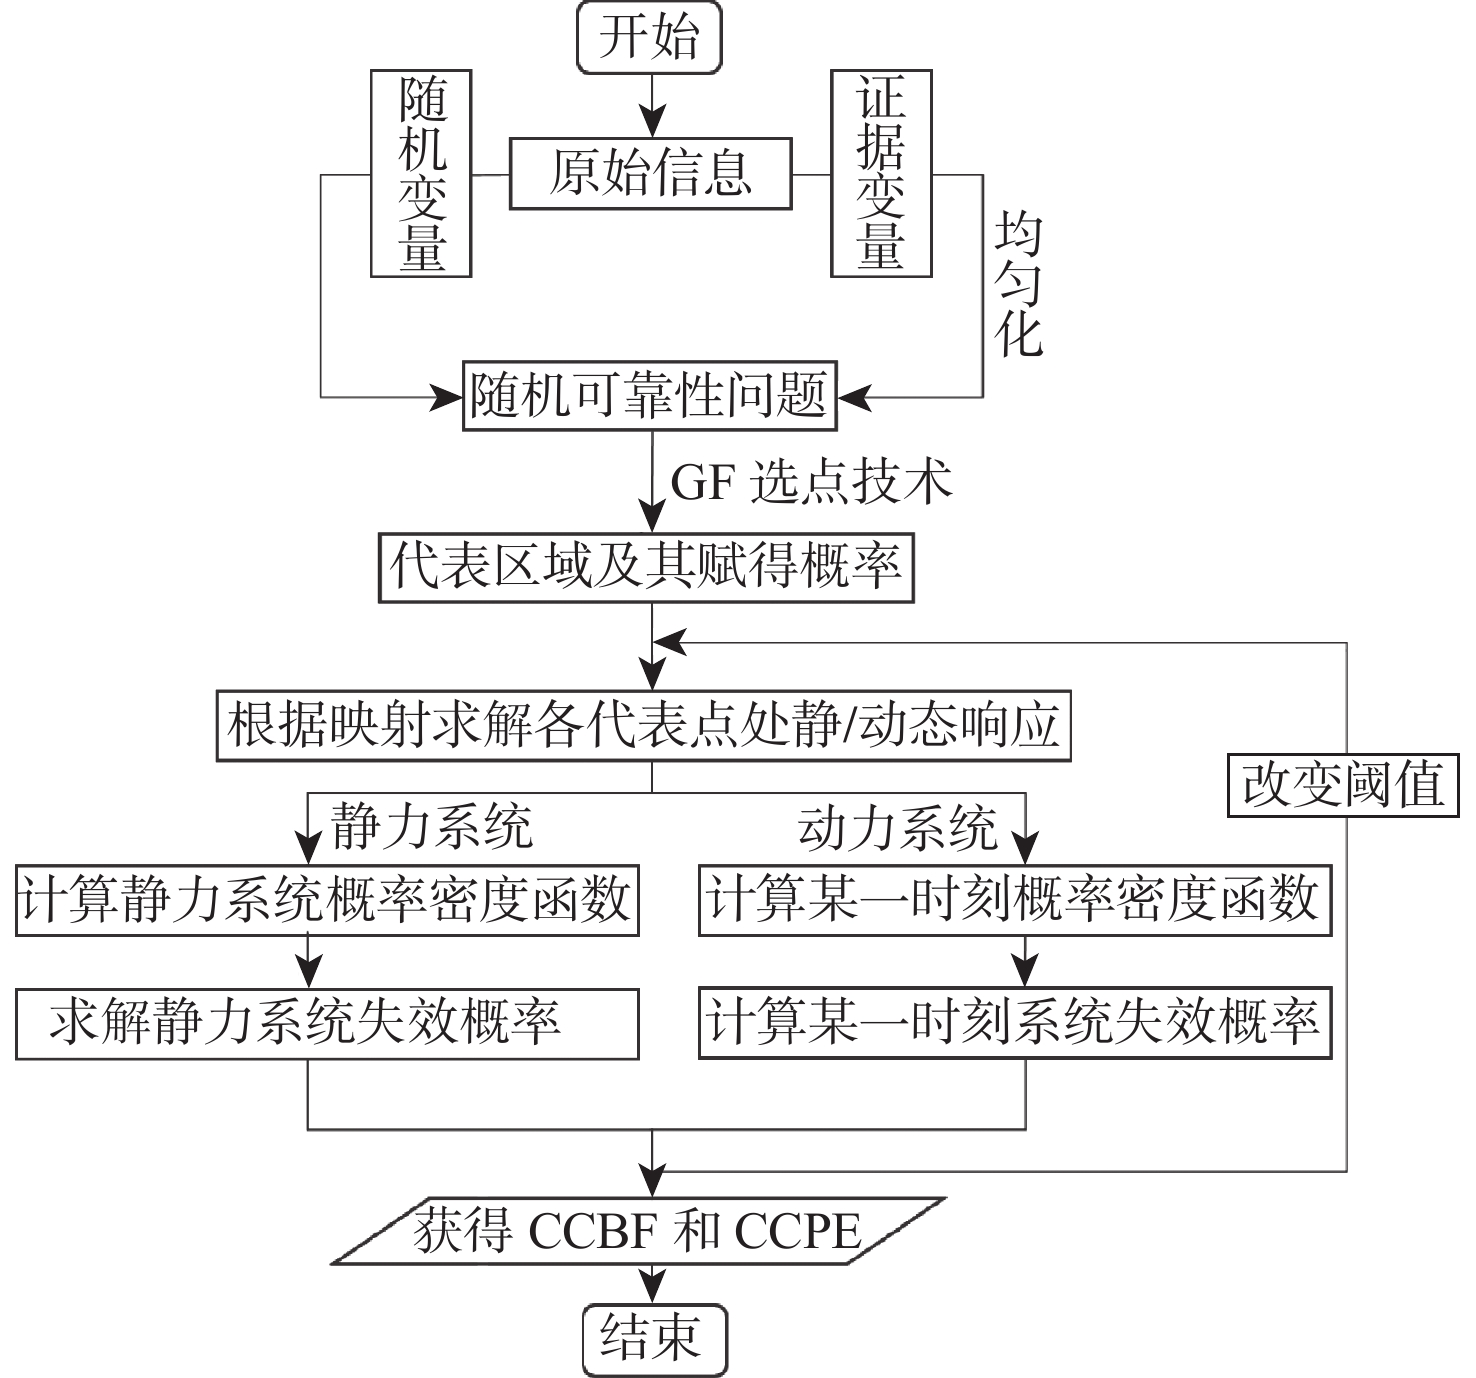
针对证据变量和随机变量混合不确定性以及极限状态函数复杂并存的情况,提出了一种基于直接概率积分法的证据-概率混合可靠性分析方法。该方法从证据理论的概率解释入手,采用证据变量均匀化方法,将证据变量转换为随机概率变量,达到混合变量归一化目的,进而通过直接概率积分法进行结构可靠性分析。最后通过3个算例对所提方法的性能进行验证,结果表明:与现有方法相比,所提方法在计算精度相近的情况下,极大地提高了计算效率。
Abstract:Based on the idea of direct probability integral, a mixed reliability analysis method is proposed for the mixed uncertainty analysis of evidence variables and random variables with a complex limit state function. The proposed method starts with the probability interpretation of evidence theory, adopts the method of unifying evidence variables for converting evidence variables into random variables, and achieve the goal of unifying two types of uncertainty. Then, the structural reliability analysis is carried out through the direct probability integral method. Finally, the performance of the proposed method is validated through three numerical examples. The results show that compared with existing methods, the proposed method greatly improves computational efficiency with similar computational accuracy.
-

图 1 不重叠证据变量随机化过程
Figure 1. Randomization process of non overlapping evidence variables

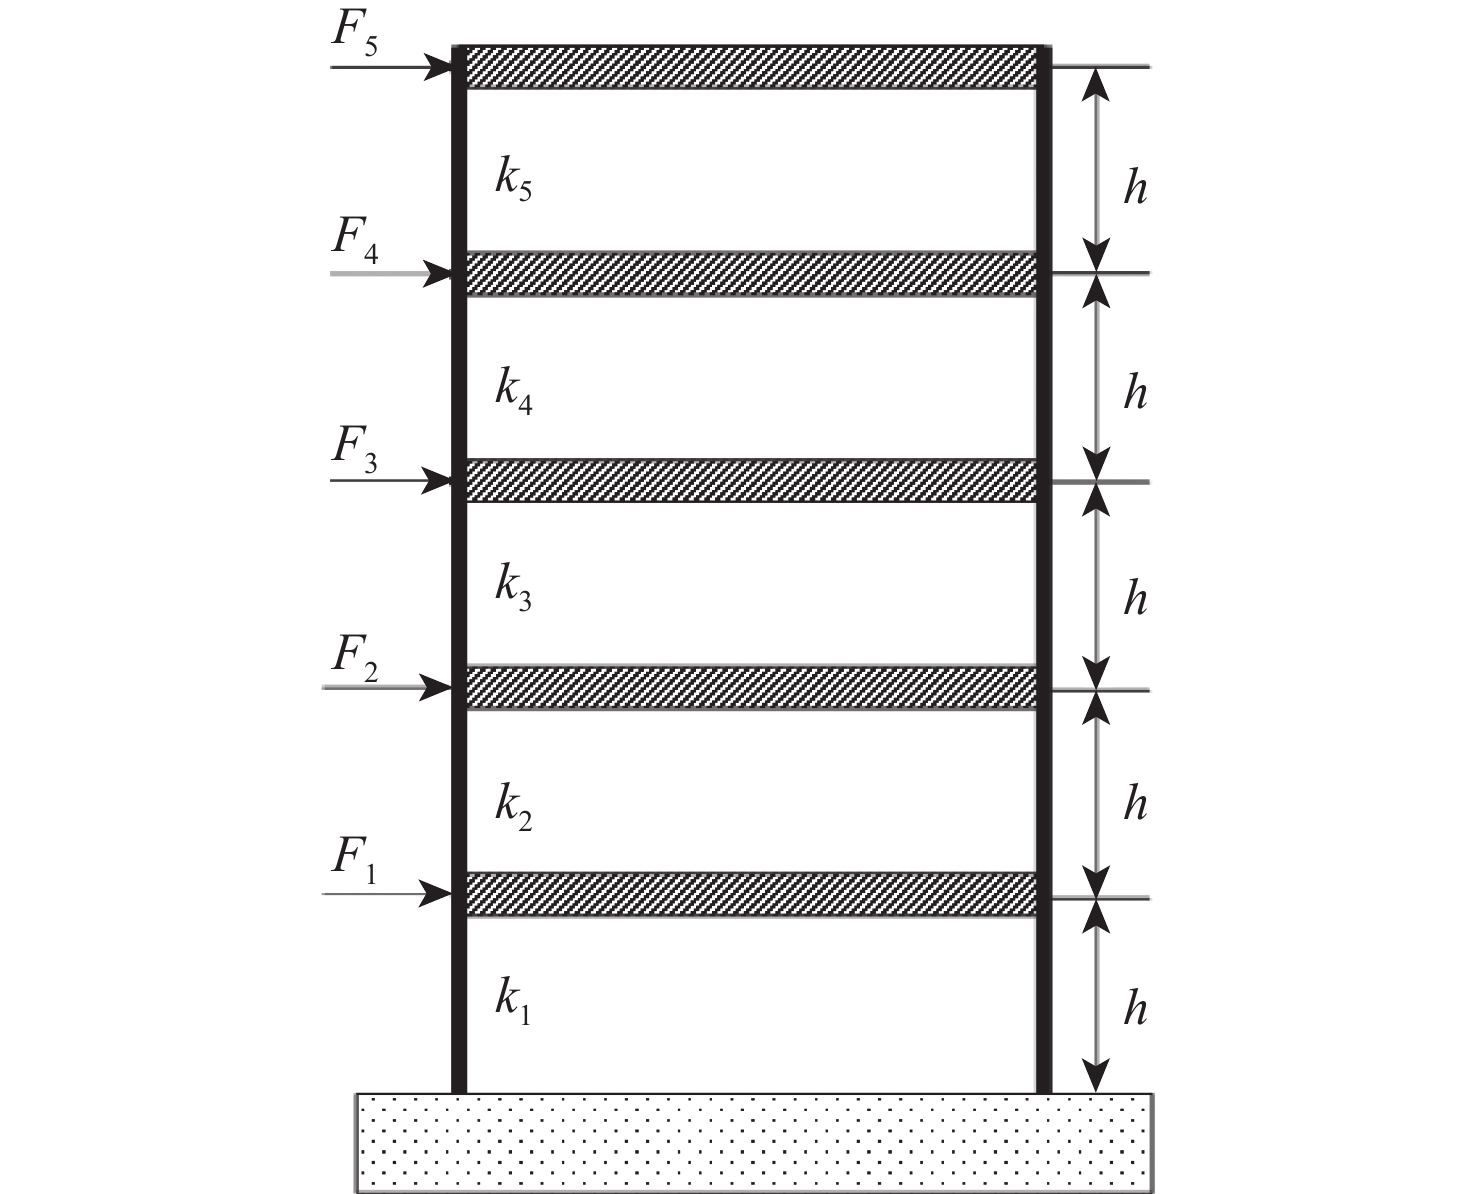
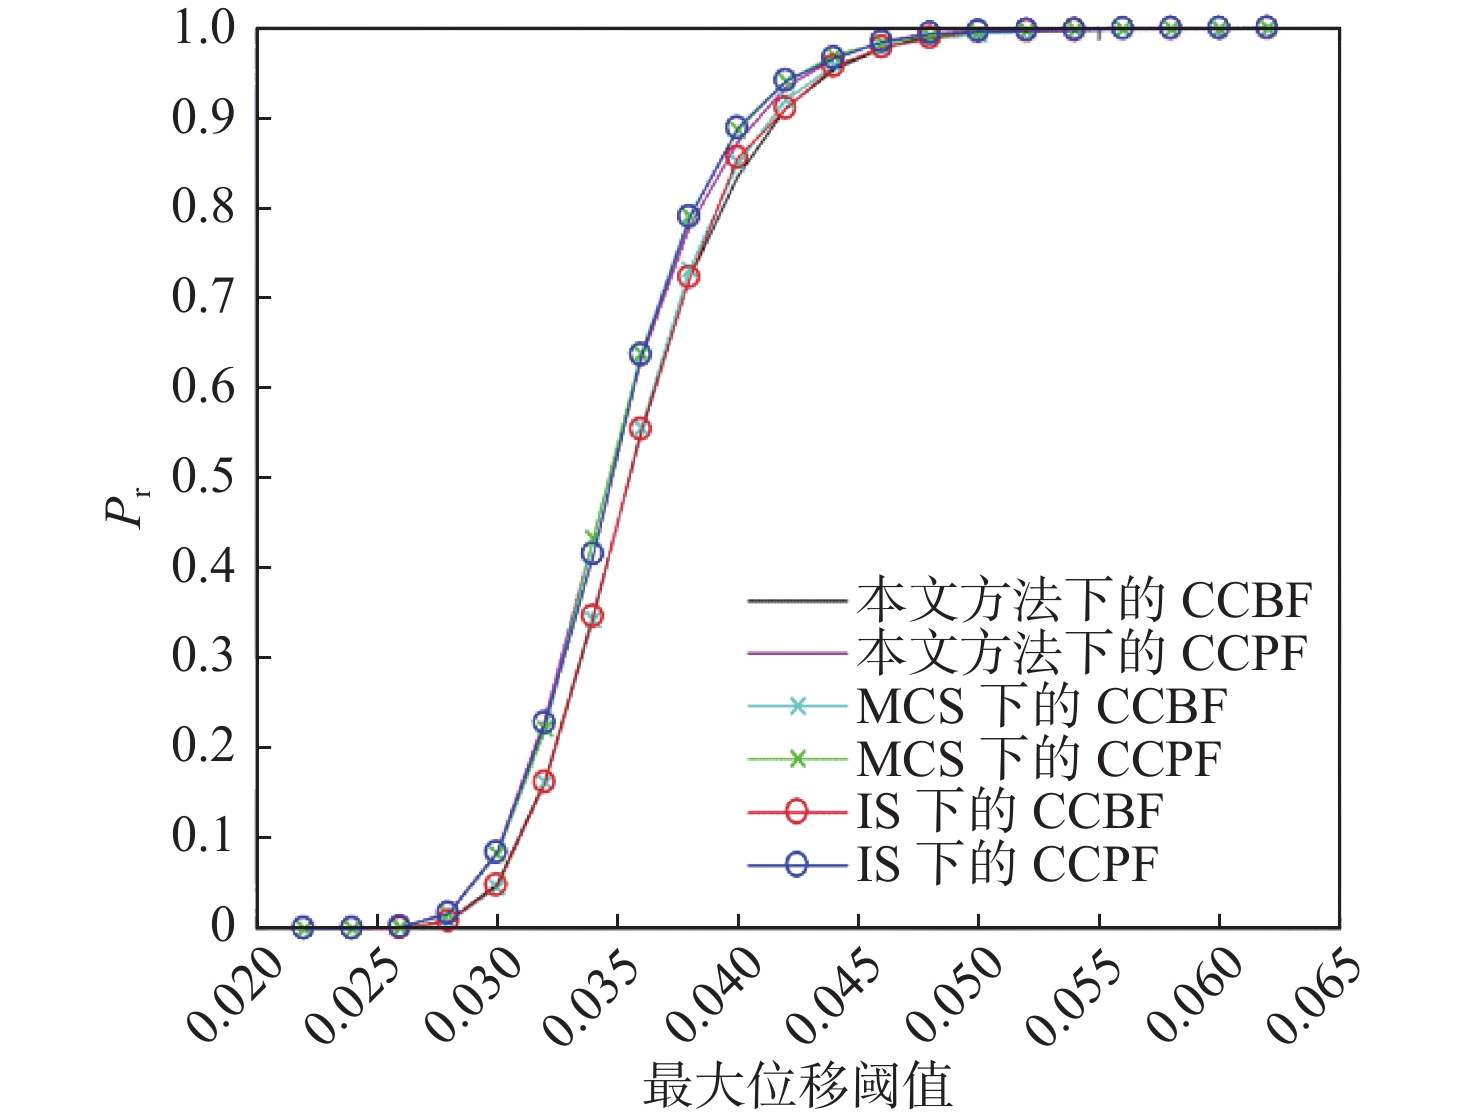
图 6 5层框架结构的CCPF和CCBF曲线
Figure 6. CCPF and CCBF curves of five story shear frame structure
表 1 算例1随机变量分布参数
Table 1. Random variable distribution parameters in Example 1
变量 分布类型 均值 标准差 ${Y_1}$ 正态 3 0.1 ${Y_2}$ 正态 2 0.3  下载: 导出CSV
表 2 算例1证据变量
Table 2. Evidence variable in Example 1
变量 取值范围 BPA ${X_1}$ [1.0,1.1] 0.3 [1.1,1.2] 0.3 [1.2,1.3] 0.4
下载: 导出CSV
表 3 算例一可靠性分析结果
Table 3. Reliability analysis results of example 1
阈值 本文方法 IS 与IS相对误差/% MCS 与MCS相对误差/% 10.0 [1.371 8×10−4,0.000 9] [1.387 2×10−4,0.000 8] [−1.12,11.1] [1.362 0×10−4,0.000 8] [0.72,11.1] 10.2 [0.000 9,0.003 0] [0.000 8,0.003 2] [11.1,−6.67] [0.000 9,0.002 9] [0.00,6.66] 10.4 [0.001 3,0.007 9] [0.001 5,0.007 8] [−15.4,1.27] [0.001 3,0.007 7] [0.00,2.53] 10.6 [0.005 6,0.016 8] [0.005 2,0.016 7] [7.14,0.60] [0.005 5,0.016 6] [1.79,1.20] 10.8 [0.011 1,0.034 8] [0.010 5,0.034 6] [5.41,0.57] [0.010 9,0.034 2] [1.80,1.72] 11.0 [0.026 1,0.066 7] [0.025 8,0.064 8] [1.15,2.85] [0.024 5,0.061 7] [6.13,7.50] 11.2 [0.050 1,0.115 6] [0.048 7,0.115 1] [2.79,0.43] [0.048 1,0.114 6] [3.99,0.87] 11.4 [0.092 5,0.182 3] [0.090 1,0.180 8] [2.59,0.82] [0.090 2,0.181 0] [2.49,0.71] 11.6 [0.150 2,0.279 2] [0.152 0,0.276 6] [−1.19,0.93] [0.147 3,0.274 1] [1.97,1.86] 11.8 [0.237 4,0.381 7] [0.236 8,0.381 1] [0.25,0.16] [0.237 2,0.380 9] [0.08,0.21] 12.0 [0.335 0,0.499 4] [0.334 1,0.499 3] [0.27,0.02] [0.330 1,0.498 0] [1.48,0.28] 12.2 [0.442 7,0.611 3] [0.441 0,0.611 7] [0.38,−0.07] [0.442 7,0.611 0] [0.00,0.05] 12.4 [0.564 8,0.722 0] [0.563 2,0.721 9] [0.28,0.01] [0.561 5,0.720 5] [0.59,0.21] 12.6 [0.676 0,0.817 5] [0.676 2,0.816 0] [−0.03,0.18] [0.675 6,0.814 2] [0.06,0.49] 12.8 [0.771 0,0.880 2] [0.771 0, 0.8788 ][0.00,0.16] [0.770 8,0.878 8] [0.02,0.16] 13.0 [0.849 0,0.929 7] [0.847 0,0.928 9] [0.24,0.09] [0.848 4,0.928 1] [0.23,0.17] 13.2 [0.908 1,0.968 5] [0.907 2,0.962 7] [0.10,0.60] [0.907 2,0.961 0] [0.10,0.78] 13.4 [0.948 4,0.978 7] [0.947 9,0.978 0] [0.05,0.07] [0.947 8,0.977 8] [0.06,0.09] 13.6 [0.971 2,0.989 8] [0.971 1,0.984 0] [0.01,0.59] [0.970 1,0.980 6] [0.11,0.94] 13.8 [0.986 5,0.995 5] [0.985 5,0.992 7] [0.10,0.28] [0.986 0,0.995 0] [0.05,0.05] 14.0 [ 0.9959 ,0.9987 ][0.994 0,0.999 1] [0.19,−0.04] [0.993 9,0.997 8] [0.20,0.09]
下载: 导出CSV
表 4 前3层结构层间刚度概率分布以及统计特性
Table 4. Probability distribution and statistical characteristics of interlayer stiffness of the first three story frame structure
层数 均值/10−5 (kN·m−1) 变异系数 ${\varTheta _1}$ 3.8 0.2 ${\varTheta _2}$ 3.6 0.2 ${\varTheta _3}$ 3.4 0.2
下载: 导出CSV
表 5 第4、5层框架结构层间刚度不确定参数
Table 5. Uncertain parameters of interlayer stiffness of the fourth and fifth story frame structure
层数 均值/10−5 (kN·m−1) 基本概率分配 ${\varTheta _4}$ [3.0,3.2] 0.4 [3.2,3.4] 0.6 ${\varTheta _5}$ [2.8,3.0] 0.4 [3.0,3.2] 0.6
下载: 导出CSV
表 6 5层框架结构可靠性分析结果
Table 6. Reliability analysis results of five story frame structure
最大位移阈值/m 本文方法 IS 与IS相对误差/% MCS 与MCS相对误差/% 0.022 [2.493 7×10−7,2.760 8×10⁻⁷] [2.378 4×10−7×10−7,2.723 1×10⁻⁷] [4.62,1.37] [2.359 6×10−7,2.680 8×10⁻⁷] [5.68,2.98] 0.024 [5.224 5×10−6,3.164 6×10⁻⁵] [5.222 6×10−6,3.124 6×10⁻⁵] [0.04,1.26] [5.211 6×10−6,3.095 6×10⁻⁵] [0.25,2.23] 0.026 [6.282 9×10−4,0.001 8] [6.235 8×10−4,0.001 8] [0.85,0.00] [6.126 8×10−4,0.001 6] [0.55,11.1] 0.028 [0.008 9,0.017 6] [0.007 9,0.016 9] [11.2,3.98] [0.008 1,0.016 6] [8.99,6.02] 0.030 [0.049 7,0.085 3] [0.047 8,0.084 6] [3.82,0.82] [0.045 8,0.083 1] [8.52,2.65] 0.032 [0.164 9,0.234 2] [0.162 3,0.228 1] [1.58,2.60] [0.162 7,0.222 2] [1.60,5.40] 0.034 [0.348 8,0.433 9] [0.346 4,0.415 6] [0.69,4.22] [0.343 7,0.433 7] [1.48,0.05] 0.036 [0.551 6,0.632 7] [0.554 2,0.636 6] [−0.47,−0.62] [0.556 3,0.638 5] [0.84,0.91] 0.038 [0.723 0,0.780 2] [0.723 1,0.790 1] [−0.01,−1.27] [0.731 9,0.791 4] [1.21,1.42] 0.040 [0.835 9,0.873 9] [0.856 0,0.888 8] [−2.40,−1.71] [0.850 4,0.886 8] [−1.73,−1.48] 0.042 [0.911 6,0.934 8] [0.910 5,0.941 2] [0.12,−0.68] [0.920 3,0.940 8] [−0.95,0.64] 0.044 [0.953 9,0.966 0] [0.957 2,0.966 6] [−0.35,−0.06] [0.958 3,0.969 3] [0.46,0.34] 0.046 [0.977 9,0.985 1] [0.978 5,0.984 6] [−0.06,0.05] [0.978 1,0.983 8] [0.06,0.13] 0.048 [0.991 8,0.994 4] [0.988 9,0.993 8] [0.29,0.06] [0.988 3,0.991 2] [0.35,0.32] 0.050 [0.996 2,0.996 9] [0.995 8,0.996 5] [0.04,0.04] [0.993 5,0.995 1] [0.27,0.18] 0.052 [0.997 7,0.998 3] [0.996 8,0.997 9] [0.09,0.04] [0.996 3,0.997 1] [0.14,0.12] 0.054 [0.999 0,0.999 2] [0.997 2,0.998 0] [0.18,0.12] [0.997 8,0.998 2] [0.12,0.10] 0.056 [0.999 3,0.999 4] [0.999 0,0.999 1] [0.03,0.03] [0.998 6,0.998 9] [0.10,0.05] 0.058 [0.999 5,0.999 6] [0.999 2,0.999 5] [0.03,0.01] [0.999 1,0.999 2] [0.04,0.04] 0.060 [0.999 7,0.999 8] [0.999 4,0.999 7] [0.03,0.01] [0.999 4,0.999 5] [0.03,0.03] 0.062 [0.999 8,0.999 9] [0.999 8,0.999 9] [0.00,0.00] [0.999 6,0.999 8] [0.02,0.01]
下载: 导出CSV
表 7 薄板的几何尺寸
Table 7. Geometric dimensions of the thin plates
变量 分布形式 均值/m 标准差 板宽a 正态分布 6 0.03 板长b 正态分布 8 0.02 板高h 正态分布 0.12 0.01
下载: 导出CSV
表 8 薄板的证据不确定性变量
Table 8. Evidence uncertainty variables for the thin plates
变量 取值范围 BPA 弹性模量E/GPa [35.8,36.2] 0.3 [36.2,36.6] 0.7 泊松比$v$ [0.15,0.20] 0.3 [0.20,0.25] 0.7 质量密度$\rho $/(kg·m−3) [ 2200 ,2400 ]0.3 [ 2400 ,2600 ]0.7
下载: 导出CSV
表 9 薄板结构可靠性分析结果
Table 9. Reliability analysis results of the thin plate
横向挠度阈值/m 本文方法 IS 与IS相对误差/% MCS 与MCS相对误差/% 0.000 60 [0.002 4,0.003 6] [0.002 4,0.003 5] [0.00,2.78] [0.002 3,0.003 5] [4.17,2.78] 0.000 64 [0.023 0,0.026 0] [0.022 4,0.025 8] [2.61,0.77] [0.022 1,0.025 3] [3.91,2.70] 0.000 68 [0.091 0,0.117 0] [0.089 6,0.116 2] [1.54,0.68] [0.089 4,0.115 1] [1.79,1.62] 0.000 72 [0.227 0,0.278 1] [0.225 2,0.277 9] [0.79,0.07] [0.224 8,0.275 2] [0.97,1.04] 0.000 76 [0.415 8,0.455 9] [0.414 4,0.455 0] [0.34,0.20] [0.413 7,0.454 4] [0.51,0.33] 0.000 80 [0.617 9,0.649 0] [0.615 9,0.647 8] [0.32,0.18] [0.616 1,0.648 2] [0.17,0.12] 0.000 84 [0.771 0,0.786 0] [0.768 8,0.780 2] [0.29,0.75] [0.769 7,0.781 5] [0.17,0.57] 0.000 88 [0.863 9,0.879 1] [0.861 5,0.876 6] [0.28,0.28] [0.859 4,0.874 3] [0.47,0.42] 0.000 92 [0.926 0,0.939 0] [0.920 8,0.936 8] [0.56,0.23] [0.921 5,0.935 4] [0.49,0.38] 0.000 96 [0.968 0,0.974 0] [0.966 6,0.970 2] [0.14,0.39] [0.965 2,0.971 5] [0.29,0.35] 0.001 00 [0.985 0,0.989 9] [0.981 0,0.988 6] [0.41,0.13] [0.981 4,0.988 9] [0.37,0.10] 0.001 04 [0.992 0,0.994 8] [0.991 5,0.993 2] [0.05,0.16] [0.991 0,0.991 9] [0.10,0.29] 0.001 08 [0.993 5,0.996 4] [0.992 6,0.995 8] [0.09,0.06] [0.992 1,0.995 0] [0.14,0.14] 0.001 12 [0.994 6,0.998 0] [0.993 8,0.997 6] [0.08,0.04] [0.994 2,0.997 3] [0.04,0.07] 0.001 16 [0.997 9,0.999 9] [0.997 8,0.998 8] [0.01,0.11] [0.997 7,0.998 4] [0.02,0.15] 0.001 20 [0.999 2,0.999 9] [0.999 1,0.999 9] [0.01,0.00] [0.999 0,0.999 6] [0.02,0.03]
下载: 导出CSV
-
[1] CHEN G H, YANG D X. Direct probability integral method for stochastic response analysis of static and dynamic structural systems[J]. Computer Methods in Applied Mechanics and Engineering, 2019, 357(C): 112612. [2] CHEN G H, YANG D X. A unified analysis framework of static and dynamic structural reliabilities based on direct probability integral method[J]. Mechanical Systems and Signal Processing, 2021, 158: 107783. doi: 10.1016/j.ymssp.2021.107783 [3] 刘思琦. 基于直接概率积分法的车—(轨)—桥耦合系统随机动力学分析[D]. 大连: 大连理工大学, 2021.LIU S Q. Stochastic dynamic analysis of vehicle-(rail)-bridge coupling system based on direct probability integral method[D]. Dalian: Dalian University of Technology, 2021(in Chinese). [4] 李小兰. 结构静/动力可靠度分析与优化设计的高效算法研究[D]. 大连: 大连理工大学, 2021.LI X L. Study on efficient algorithms for static/dynamic reliability analysis and reliability-based design optimization of structures[D]. Dalian: Dalian University of Technology, 2021(in Chinese). [5] 李石. 结构特性相关的显式时程积分算法性能改进及工程应用[D]. 大连: 大连理工大学, 2021.LI S. Performance improvement and engineering application of explicit structure-dependent time integration algorithms[D]. Dalian: Dalian University of Technology, 2021(in Chinese). [6] 高天骁, 李铸珅, 张佳旺, 等. 基于直接概率积分法的重载铁路RC梁疲劳可靠度分析[J]. 铁道科学与工程学报, 2023, 20(4): 1416-1424.GAO T X, LI Z S, ZHANG J W, et al. Fatigue reliability analysis of RC beams in heavy-haul railways based on direct probability integral method[J]. Journal of Railway Science and Engineering, 2023, 20(4): 1416-1424(in Chinese). [7] MENG Z, ZHAO J Y, CHEN G H, et al. Hybrid uncertainty propagation and reliability analysis using direct probability integral method and exponential convex model[J]. Reliability Engineering & System Safety, 2022, 228: 108803. [8] DEMPSTER A P, LAIRD N M, RUBIN D B. Maximum likelihood from incomplete data via the EM algorithm[J]. Journal of the Royal Statistical Society: Series B (Methodological), 1977, 39(1): 1-22. doi: 10.1111/j.2517-6161.1977.tb01600.x [9] SHAFER G. A mathematical theory of evidence[M]. Princeton: Princeton University Press, 1976. [10] 范松. 基于证据理论的机械可靠性分析及优化设计方法[D]. 长沙: 湖南大学, 2015.FAN S. An evidence-theory based mechanical reliability analysis method and optimization design method[D]. Changsha: Hunan University, 2015(in Chinese). [11] OBERKAMPF W L, HELTON J C. Investigation of evidence theory for engineering application, non-deterinistic approaches forum[C]//Proceedings of the 4th Non-Deterministic Approaches Forum. Reston: AIAA, 2002, 43: 8-11. [12] BAE H R, GRANDHI R V, CANFIELD R A. Sensitivity analysis of structural response uncertainty propagation using evidence theory[J]. Structural and Multidisciplinary Optimization, 2006, 31(4): 270-279. doi: 10.1007/s00158-006-0606-9 [13] BAI Y C, HAN X, JIANG C, et al. Comparative study of metamodeling techniques for reliability analysis using evidence theory[J]. Advances in Engineering Software, 2012, 53: 61-71. doi: 10.1016/j.advengsoft.2012.07.007 [14] ZHANG Z, JIANG C, HAN X, et al. A response surface approach for structural reliability analysis using evidence theory[J]. Advances in Engineering Software, 2014, 69: 37-45. doi: 10.1016/j.advengsoft.2013.12.005 [15] WANG Y W, FENG H L. Reliability analysis based on inverse Gauss degradation process and evidence theory[J]. International Journal of Performability Engineering, 2019, 15(2): 353-361. [16] DU X P. Uncertainty analysis with probability and evidence theories[C]// Proceedings of the ASME 2006 International Design Engineering Technical Conferences and Computers and Information in Engineering Conference. Philadelphia: ASME, 2006: 1025-1038. [17] 姜潮, 范松, 张哲, 等. 一种高效的概率-证据混合可靠性分析方法[J]. 计算力学学报, 2016, 33(2): 135-143. doi: 10.7511/jslx201602001JIANG C, FAN S, ZHANG Z, et al. An efficient structural reliability anslysis method with both probability variable and evidence variable[J]. Chinese Journal of Computational Mechanics, 2016, 33(2): 135-143(in Chinese). doi: 10.7511/jslx201602001 [18] TAO Y R, HAN X, DUAN S Y, et al. Reliability analysis for multidisciplinary systems with the mixture of epistemic and aleatory uncertainties[J]. International Journal for Numerical Methods in Engineering, 2014, 97(1): 68-78. doi: 10.1002/nme.4587 [19] 梁云飞, 张德权, 彭周源. 一种高效的概率-证据混合工业机器人定位精度可靠性分析方法[J]. 燕山大学学报, 2022, 46(4): 309-318. doi: 10.3969/j.issn.1007-791X.2022.04.003LIANG Y F, ZHANG D Q, PENG Z Y. An efficient reliability analysis method for positioning accuracy of industrial robot through probability and evidence theory[J]. Journal of Yanshan University, 2022, 46(4): 309-318(in Chinese). doi: 10.3969/j.issn.1007-791X.2022.04.003 [20] 曹亮, 陈国强, 董丽君, 等. 基于概率论和证据理论的小概率问题可靠性分析[J]. 湖南工程学院学报(自然科学版), 2019, 29(2): 30-35.CAO L, CHEN G Q, DONG L J, et al. Reliability analysis of small probability problem based on probality and evidence theory[J]. Journal of Hunan Institute of Engineering (Natural Science Edition), 2019, 29(2): 30-35(in Chinese). [21] 张梦. 基于区间-概率混合模型的在役桥梁可靠性评估[J]. 黑龙江交通科技, 2023, 46(3): 80-82,86. doi: 10.3969/j.issn.1008-3383.2023.03.026ZHANG M. Reliability evaluation of in service bridges based on interval stochastic hybrid model[J]. Communications Science and Technology Heilongjiang, 2023, 46(3): 80-82,86(in Chinese). doi: 10.3969/j.issn.1008-3383.2023.03.026 [22] 孟增, 汪栋梁, 郝鹏. 面向概率-区间混合可靠性分析的自适应共轭控制方法与应用[J]. 应用力学学报, 2022, 39(6): 1076-1085.MENG Z, WANG D L, HAO P. Adaptive conjugate control method for probability-interval hybrid reliability analysis and its engineering application[J]. Chinese Journal of Applied Mechanics, 2022, 39(6): 1076-1085(in Chinese). [23] JIANG C, ZHANG Z, HAN X, et al. A novel evidence-theory-based reliability analysis method for structures with epistemic uncertainty[J]. Computers & Structures, 2013, 129: 1-12. [24] CHEN J B, YANG J Y, LI J. A GF-discrepancy for point selection in stochastic seismic response analysis of structures with uncertain parameters[J]. Structural Safety, 2016, 59: 20-31. doi: 10.1016/j.strusafe.2015.11.001 -

 下载:
下载:


 点击查看大图
计量
- 文章访问数: 243
- HTML全文浏览量: 72
- PDF下载量: 3
- 被引次数: 0
