


-
摘要:
现有的全景图像质量评价(OIQA)模型在提取各视口局部特征时相对独立,导致计算复杂度较高,且难以利用端到端的融合模型对各视口间的关联性进行刻画。针对该问题,提出了一种基于特征共享和多视口自适应融合的质量评价方法。利用共享的骨干网络,将现有方法中互相独立的视口分割与计算任务转换到特征域,使得仅经1次前馈计算即可提取整个图像的局部特征。在此基础上,引入基于球面均匀采样的特征域视口分割方法以保证观察空间和表示空间的像素密度一致,并用语义信息指导各视口局部质量特征的自适应融合。所提方法在压缩的虚拟现实图像质量(CVIQ)数据集和OIQA数据集上的Pearson线性相关系数(PLCC)和Spearman秩相关系数(SRCC)均在0.96以上,与现有主流评价方法相比达到最优。相较于传统评价方法结构相似性指数(SSIM),所提方法在2个数据集上的平均PLCC和平均SRCC分别提高了9.52%和8.7%;相较于最新评价方法多感知特征图像质量评价(MPFIQA),所提方法在2个数据集上的平均PLCC和平均SRCC分别提高了1.71%和1.44%。
Abstract:Existing omnidirectional image quality assessment (OIQA) models extract local features from each viewport independently, increasing computational complexity and making it difficult to describe the correlations between viewports using an end-to-end fusion model. To solve these issues, a quality assessment method was proposed based on feature sharing and adaptive fusion of multiple viewports. By utilizing shared backbone networks, the method transformed the viewport segmentation and computation that were independent of each other to the feature domain, enabling local feature extraction of the image through one-shot feed-forward computation. In addition, a viewport segmentation method in the feature domain using spherical uniform sampling was employed to guarantee consistent pixel density between view space and observation space, with semantic information guiding the adaptive fusion of local quality features of viewpoints. The Pearson linear correlation coefficient (PLCC) and Spearman rank order correlation coefficient (SRCC) on the compressed virtual reality image quality (CVIQ) and OIQA datasets were both above 0.96, showing superior performance compared with mainstream evaluation methods. Compared with the traditional evaluation method structural similarity index measure (SSIM), its average PLCC and average SRCC on the above two datasets were improved by 9.52% and 8.7%, respectively; compared with the latest evaluation method multi-perceptual features image quality assessment (MPFIQA), its average PLCC and average SRCC were improved by 1.71% and 1.44%, respectively.
-
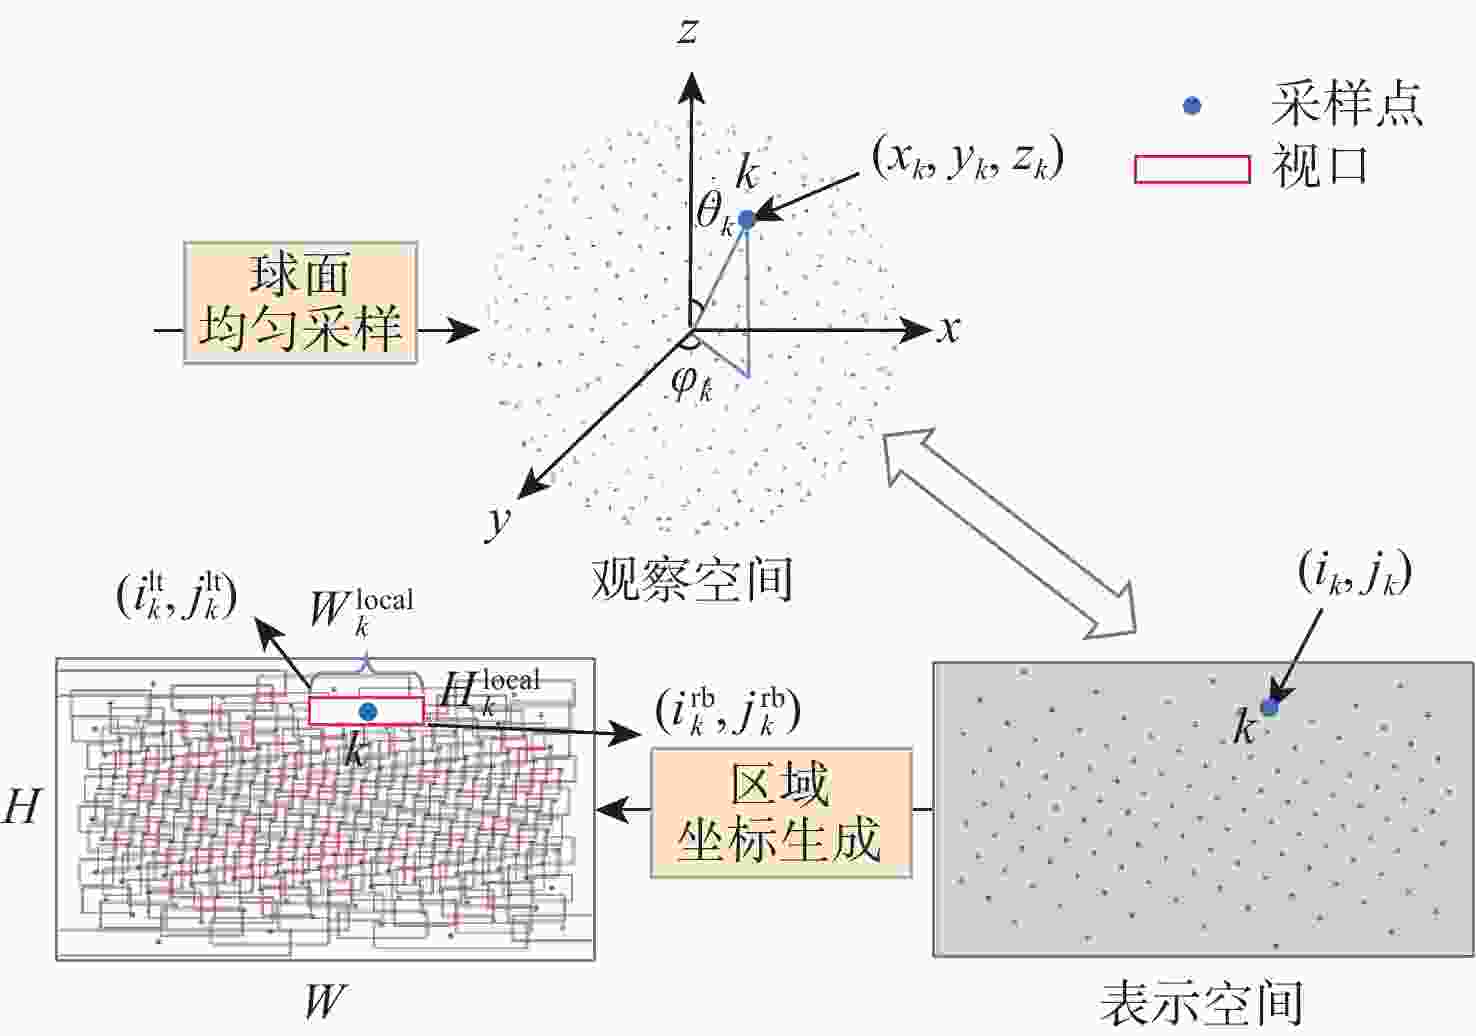
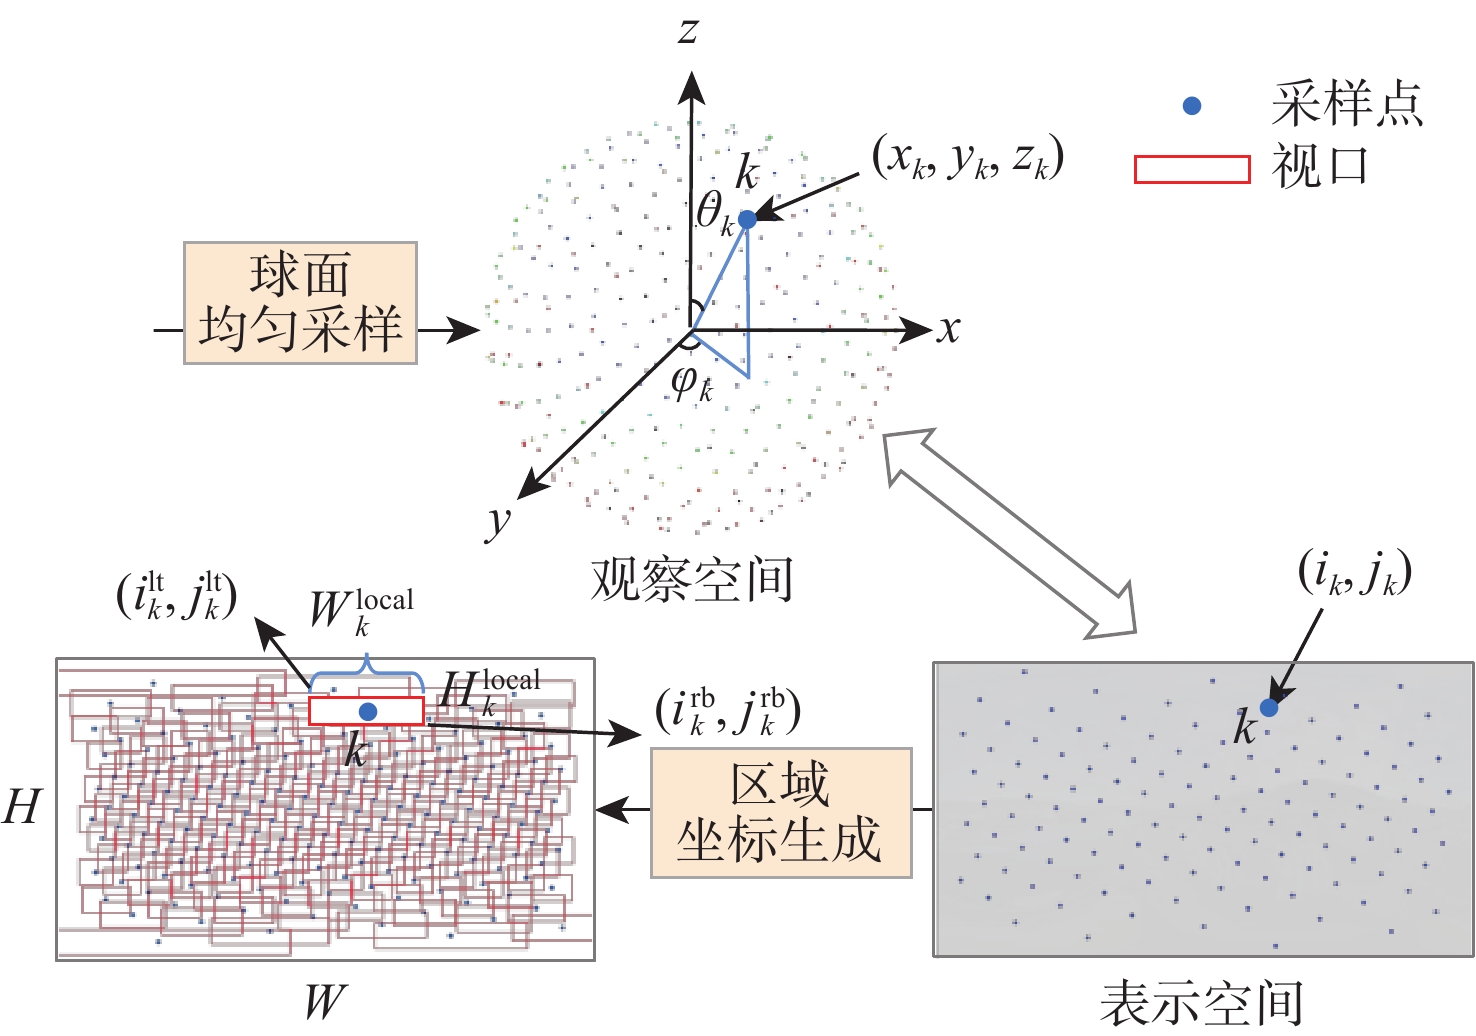
图 3 基于球面均匀采样的非均匀视口分割
Figure 3. Non-uniform viewport segmentation based on spherical uniform sampling
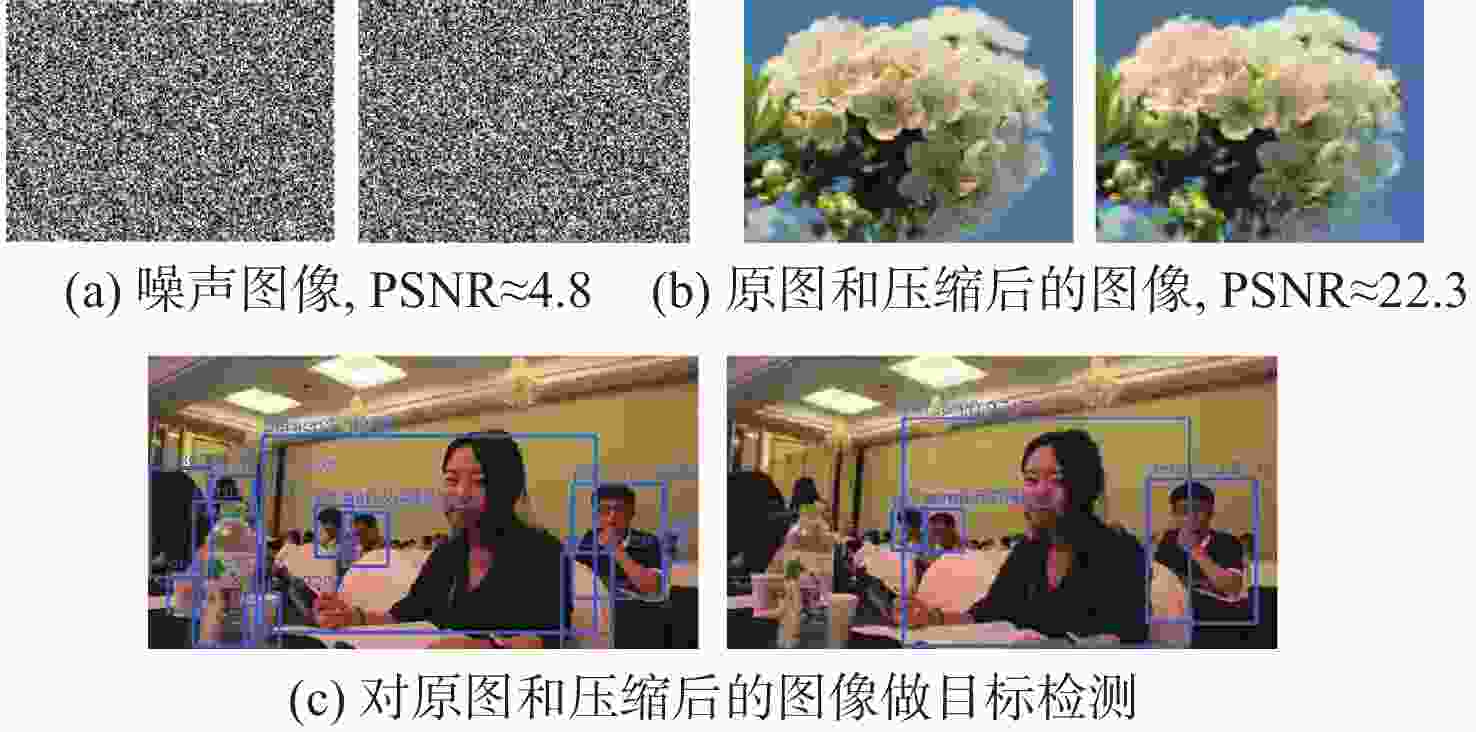
图 4 质量感知与语义识别任务间的相互依赖关系示例
Figure 4. Illustration of interdependent relationships between quality perception and semantic recognition
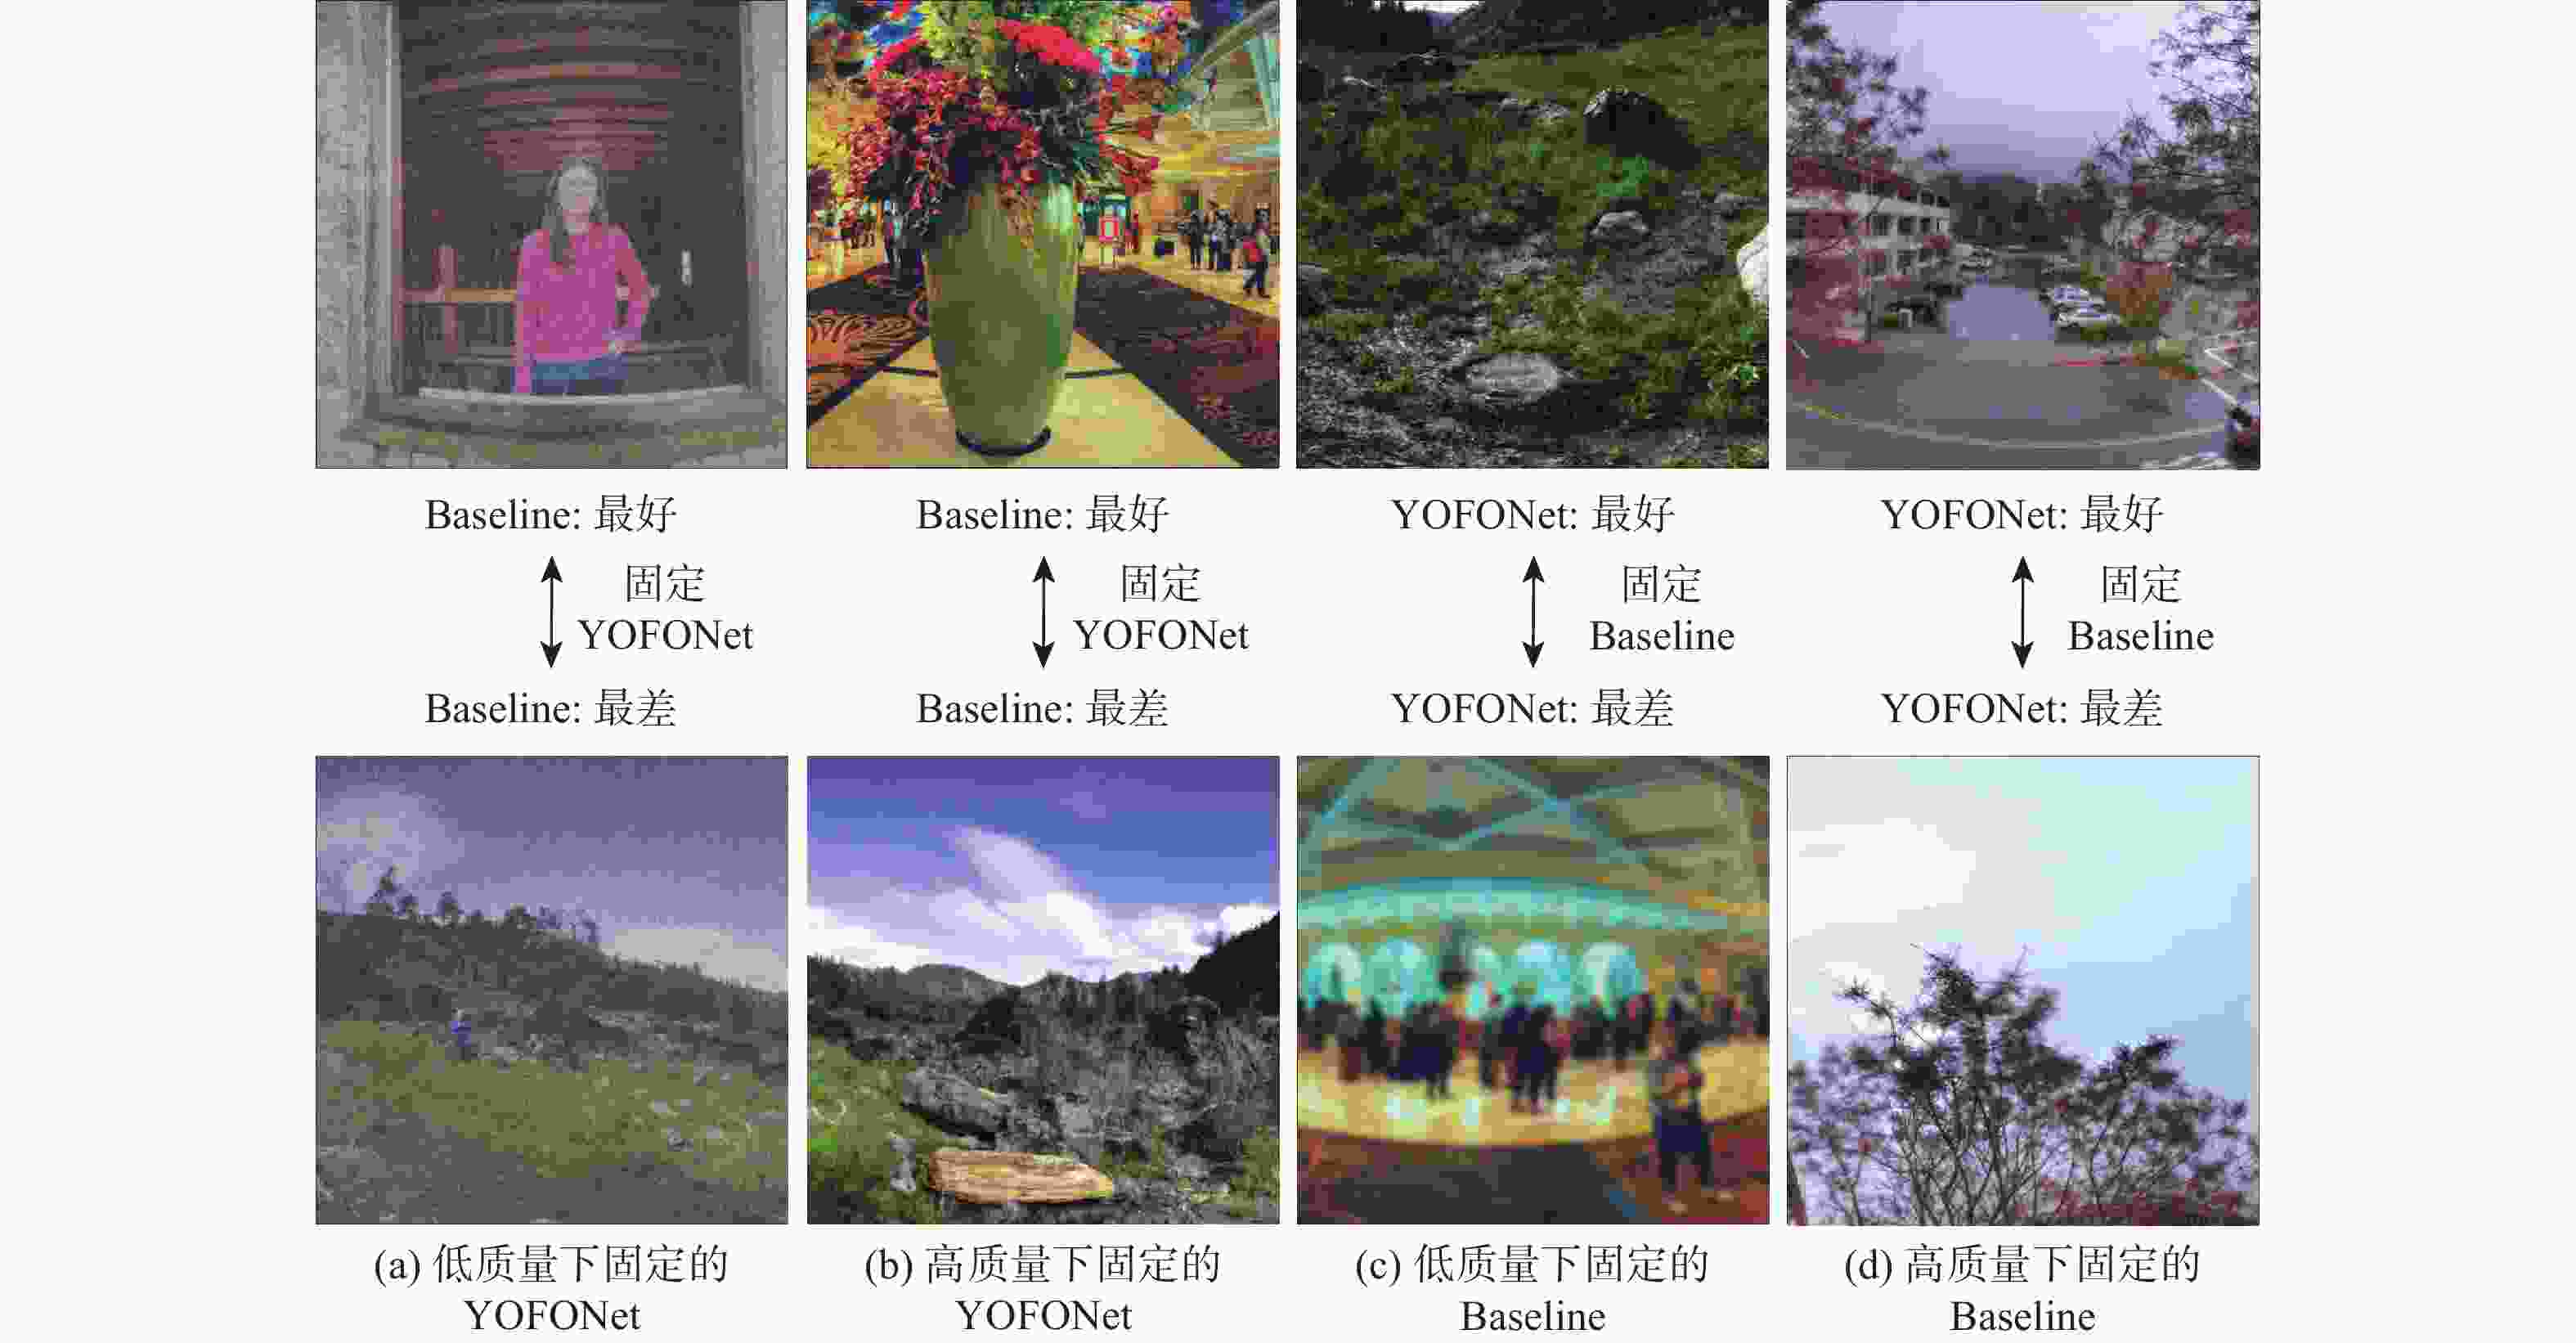
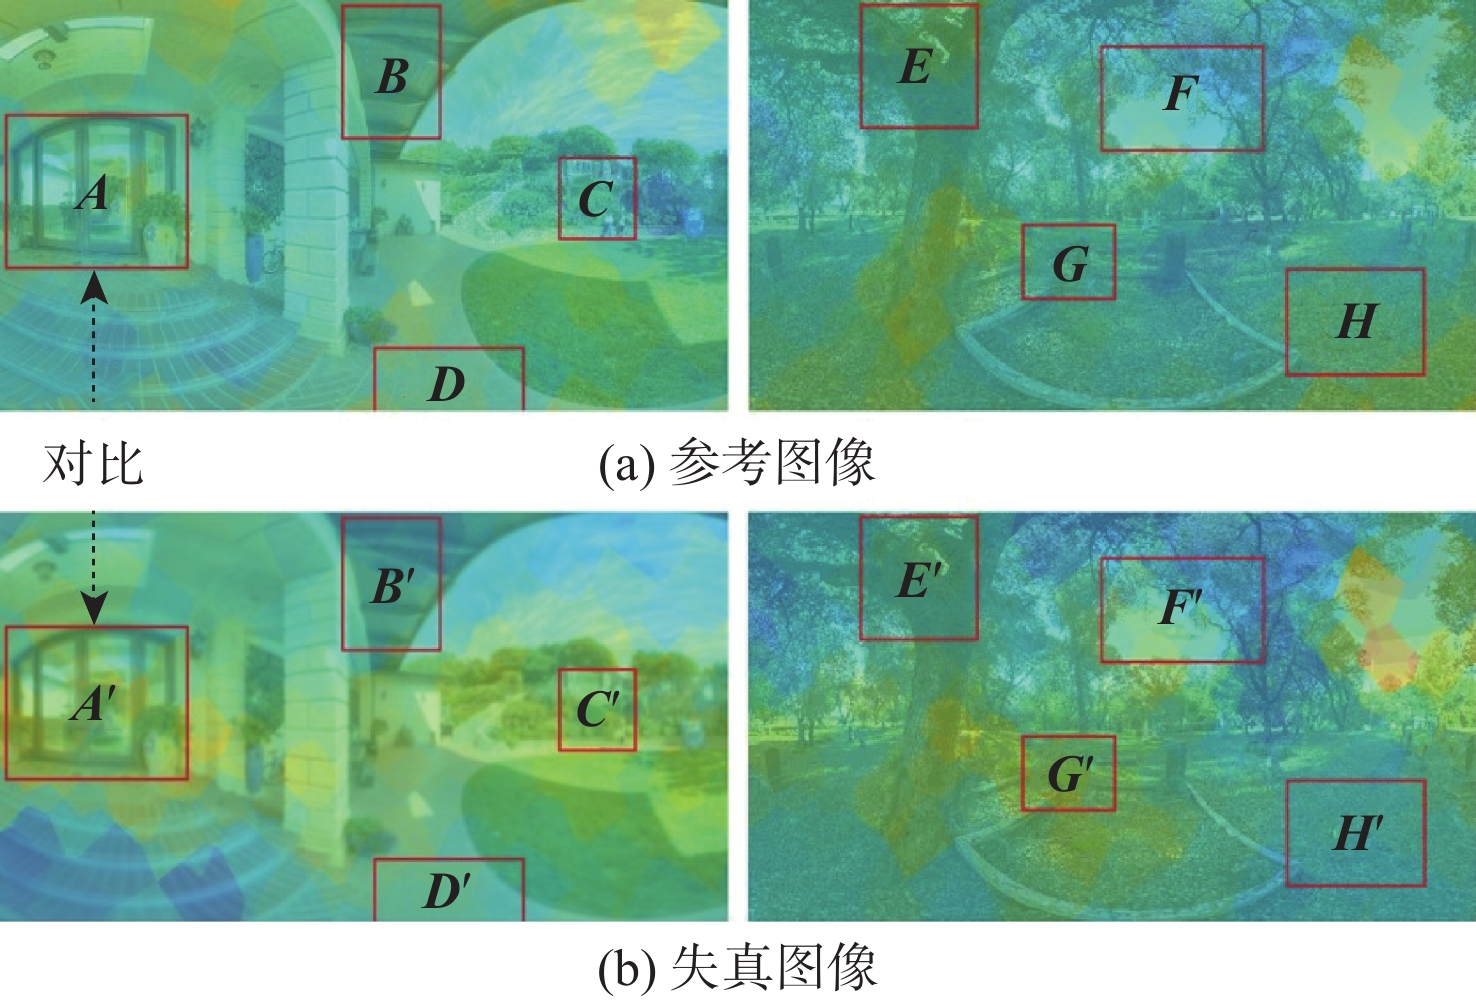
图 5 YOFONet与基准模型的gMAD竞争结果
Figure 5. gMAD competition between YOFONet and baseline models
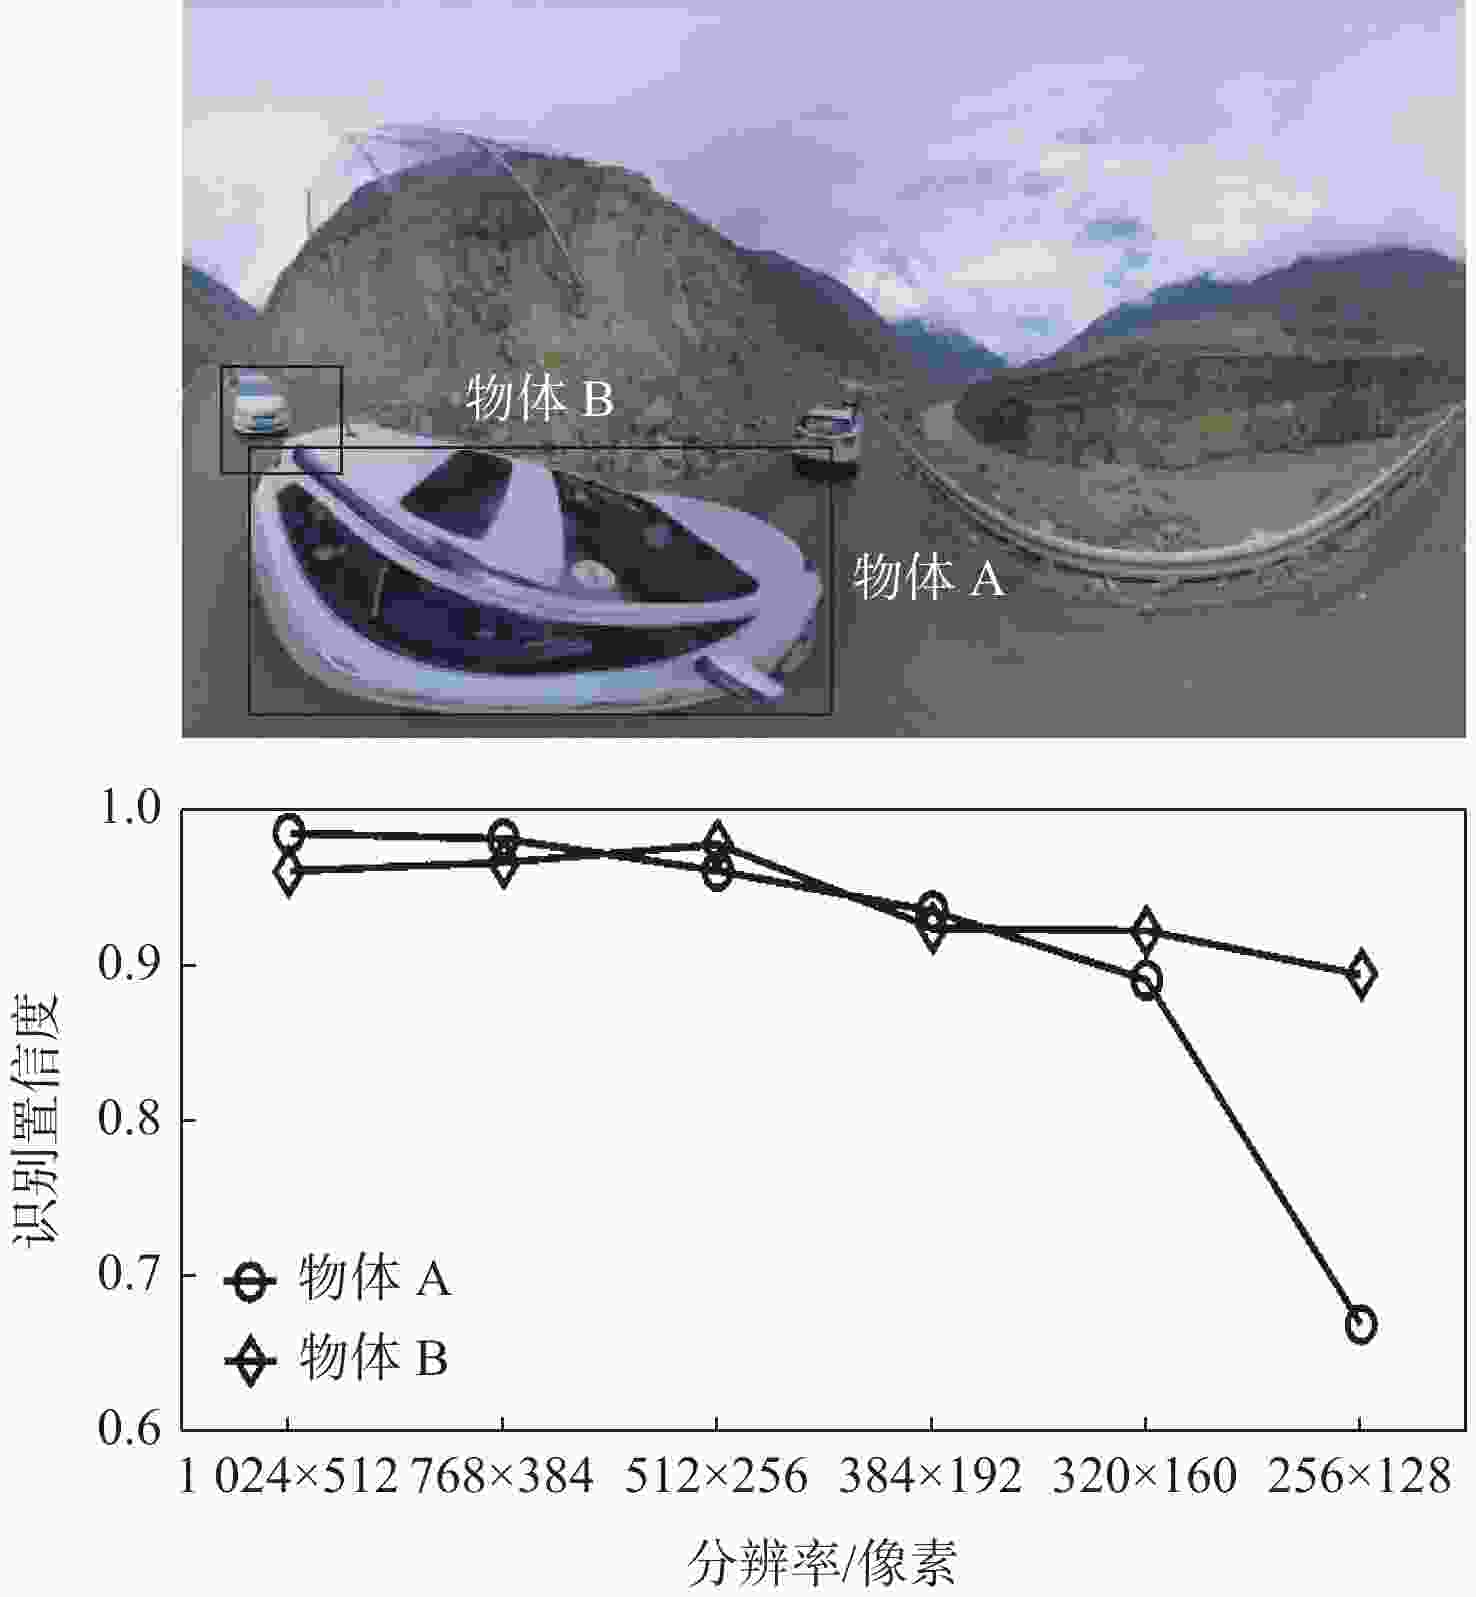
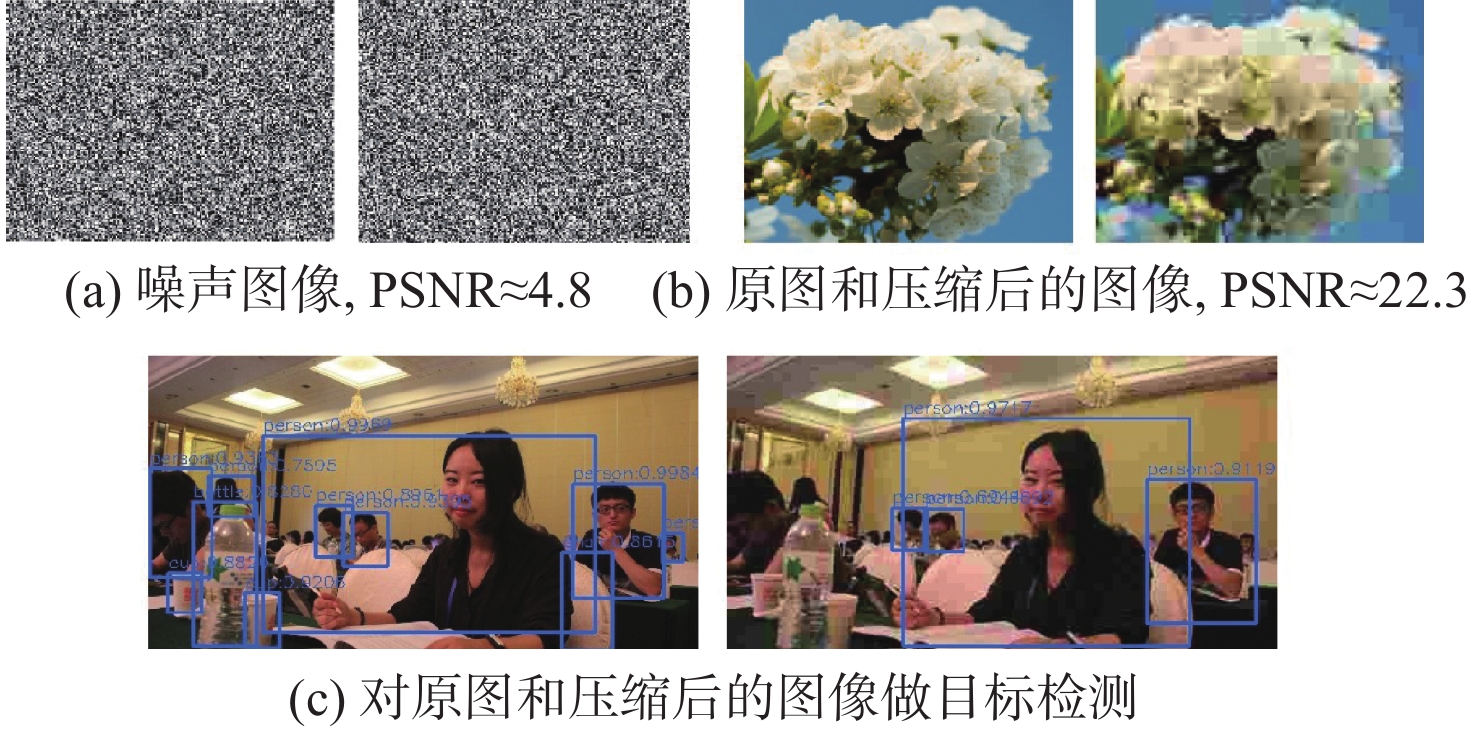
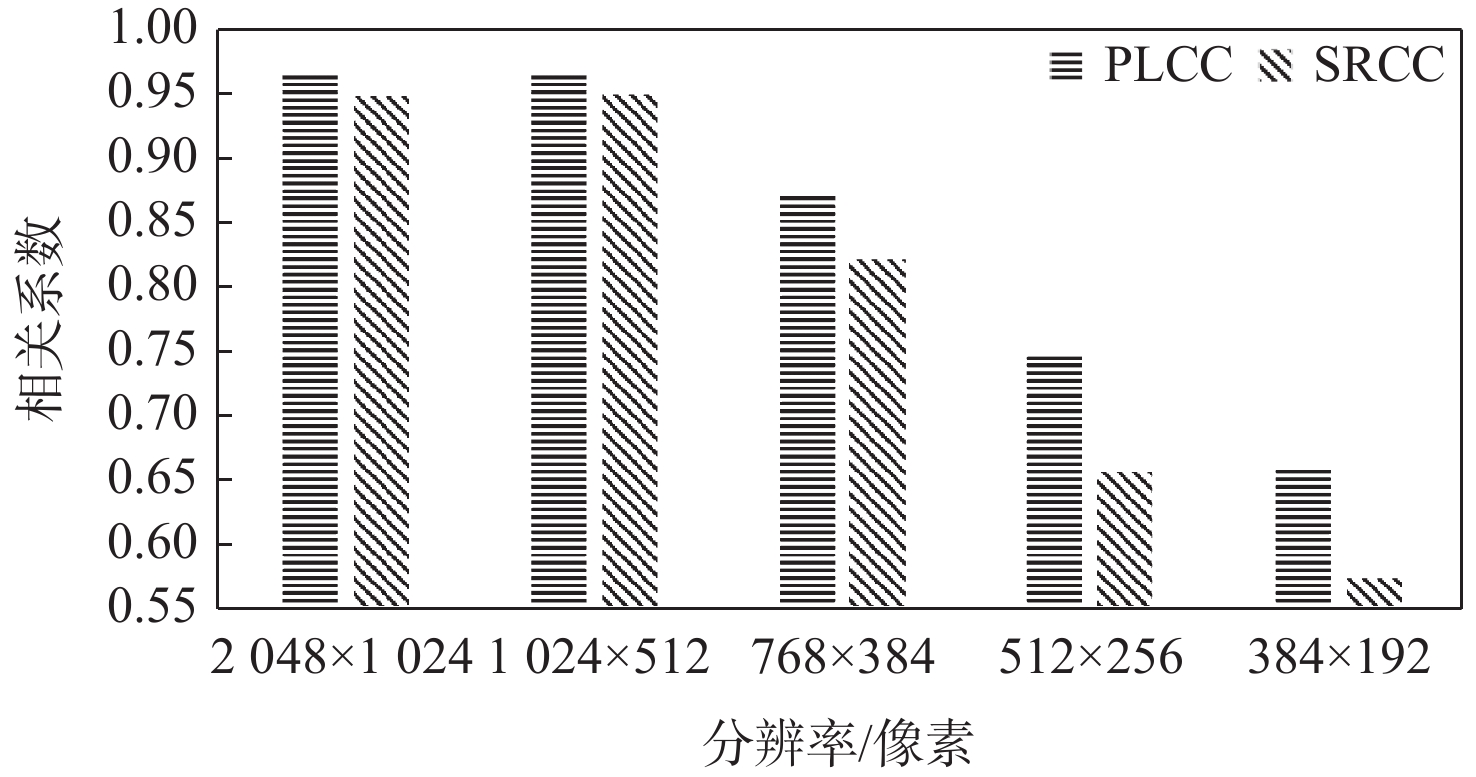
图 7 投影畸变对识别模型性能的影响
Figure 7. Influence of projection distortion on recognition model performance
表 1 CVIQ和OIQA数据集信息统计
Table 1. Information on CVIQ and OIQA datasets
数据集 参考图像数量 失真图像数量 失真类型 分辨率 主观实验人数 量表等级 头显设备 CVIQ 16 528 JPEG/AVC/HEVC 4096 ×2048 20 10 HTC Vive OIQA 16 320 JPEG/JPEG2000/GB/WGN 11332 ×5666 /13322 ×6661 20 10 HTC Vive  下载: 导出CSV
表 2 CVIQ和OIQA数据集上模型性能比较
Table 2. Performance comparison of models on CVIQ and OIQA datasets
类型 算法 PLCC SRCC CVIQ OIQA CVIQ OIQA 全参考 PSNR 0.7320 0.6918 0.7662 0.6802 WS-PSNR[11] 0.7498 0.6985 0.7755 0.6932 SSIM[34] 0.8857 0.8892 0.8972 0.8798 MS-SSIM[35] 0.8762 0.8427 0.8875 0.8332 无参考 NIQE[37] − 0.5126 0.4701 0.5329 − 0.3306 BRISQUE[36] − 0.7448 0.7778 0.7641 − 0.7794 MC360IQA[8] 0.9506 0.9247 0.9139 0.9187 MPFIQA[13] 0.9530 0.9583 0.9466 0.9574 AHGCN[17] 0.9658 0.9682 0.9617 0.9647 本文 0.9715 0.9724 0.9639 0.9675 注:粗体表示性能最好的模型。
下载: 导出CSV
表 3 消融实验结果(CVIQ数据集)
Table 3. Ablation experiment results (CVIQ dataset)
名称 模块 PLCC SRCC 多尺度特
征融合语义-质
量聚合非均匀视
口分割Baseline × × × 0.9201 0.8849 Model1 × × × 0.9400 0.9080 Model2 √ × × 0.9444 0.9179 Model3 √ √ × 0.9590 0.9354 Model4 √ √ √ 0.9627 0.9455 YOFONet √ √ √ 0.9674 0.9506 注:粗体表示性能最好。
下载: 导出CSV
-
[1] 叶成英, 李建微, 陈思喜. VR全景视频传输研究进展[J]. 计算机应用研究, 2022, 39(6): 1601-1607.YE C Y, LI J W, CHEN S X. Research progress of VR panoramic video transmission[J]. Application Research of Computers, 2022, 39(6): 1601-1607(in Chinese). [2] ZHAI G T, MIN X K. Perceptual image quality assessment: a survey[J]. Science China Information Sciences, 2020, 63(11): 211301. doi: 10.1007/s11432-019-2757-1 [3] 曾焕强, 丁瑞, 黄海靓, 等. 沉浸式视频质量评价综述[J]. 信号处理, 2022, 38(9): 1853-1862.ZENG H Q, DING R, HUANG H L, et al. Immersive video quality assessment: an overview[J]. Journal of Signal Processing, 2022, 38(9): 1853-1862(in Chinese). [4] LIU Y, YU H W, HUANG B Q, et al. Blind omnidirectional image quality assessment based on structure and natural features[J]. IEEE Transactions on Instrumentation and Measurement, 2021, 70: 5014011. [5] JIANG H, JIANG G Y, YU M, et al. Cubemap-based perception-driven blind quality assessment for 360-degree images[J]. IEEE Transactions on Image Processing, 2021, 30: 2364-2377. doi: 10.1109/TIP.2021.3052073 [6] TRUONG T Q, TRAN H T T, THANG T C. Non-reference quality assessment model using deep learning for omnidirectional images[C]//Proceedings of the IEEE 10th International Conference on Awareness Science and Technology. Piscataway: IEEE Press, 2019: 1-5. [7] XU J H, ZHOU W, CHEN Z B. Blind omnidirectional image quality assessment with viewport oriented graph convolutional networks[J]. IEEE Transactions on Circuits and Systems for Video Technology, 2021, 31(5): 1724-1737. doi: 10.1109/TCSVT.2020.3015186 [8] SUN W, MIN X K, ZHAI G T, et al. MC360IQA: a multi-channel CNN for blind 360-degree image quality assessment[J]. IEEE Journal of Selected Topics in Signal Processing, 2020, 14(1): 64-77. doi: 10.1109/JSTSP.2019.2955024 [9] DOSOVITSKIY A, BEYER L, KOLESNIKOV A, et al. An image is worth 16×16 words: transformers for image recognition at scale[C]//The 9th International Conference on Learning Representations. [S.l.:s.n.], 2021: 1-21. [10] YU M, LAKSHMAN H, GIROD B. A framework to evaluate omnidirectional video coding schemes[C]//Proceedings of the IEEE International Symposium on Mixed and Augmented Reality. Piscataway: IEEE Press, 2015: 31-36. [11] YULE S, LU A, LU Y. Weighted-to-spherically-uniform quality evaluation for omnidirectional video[J]. IEEE Signal Processing Letters, 2017, 24(9): 1408-1412. [12] ZAKHARCHENKO V, CHOI K P, PARK J H. Quality metric for spherical panoramic video[C]//Proceedings of the Optics and Photonics for Information Processing X. Bellingham: SPIE Press, 2016, 9970: 57-65. [13] LIU Y, YIN X H, WAN Z L, et al. Toward a no-reference omnidirectional image quality evaluation by using multi-perceptual features[J]. ACM Transactions on Multimedia Computing, Communications, and Applications, 2023, 19(2): 1-19. [14] KIM H G, LIM H T, RO Y M. Deep virtual reality image quality assessment with human perception guider for omnidirectional image[J]. IEEE Transactions on Circuits and Systems for Video Technology, 2020, 30(4): 917-928. doi: 10.1109/TCSVT.2019.2898732 [15] BOSSE S, MANIRY D, MÜLLER K R, et al. Deep neural networks for no-reference and full-reference image quality assessment[J]. IEEE Transactions on Image Processing, 2018, 27(1): 206-219. doi: 10.1109/TIP.2017.2760518 [16] MA K D, LIU W T, ZHANG K, et al. End-to-end blind image quality assessment using deep neural networks[J]. IEEE Transactions on Image Processing, 2018, 27(3): 1202-1213. doi: 10.1109/TIP.2017.2774045 [17] FU J, HOU C, ZHOU W, et al. Adaptive hypergraph convolutional network for no-reference 360-degree image quality assessment[C]//Proceedings of the 30th ACM International Conference on Multimedia. New York: ACM, 2022: 961-969. [18] ZHOU W, XU J H, JIANG Q P, et al. No-reference quality assessment for 360-degree images by analysis of multifrequency information and local-global naturalness[J]. IEEE Transactions on Circuits and Systems for Video Technology, 2022, 32(4): 1778-1791. doi: 10.1109/TCSVT.2021.3081182 [19] HE K M, ZHANG X Y, REN S Q, et al. Spatial pyramid pooling in deep convolutional networks for visual recognition[C]//European Conference on Computer Vision. Berlin: Springer, 2014: 346-361. [20] KE J J, WANG Q F, WANG Y L, et al. MUSIQ: multi-scale image quality transformer[C]//Proceedings of the IEEE/CVF International Conference on Computer Vision. Piscataway: IEEE Press, 2021: 5128-5137. [21] SU S L, YAN Q S, ZHU Y, et al. Blindly assess image quality in the wild guided by a self-adaptive hyper network[C]//Proceedings of the IEEE/CVF Conference on Computer Vision and Pattern Recognition. Piscataway: IEEE Press, 2020: 3664-3673. [22] DENG J, DONG W, SOCHER R, et al. ImageNet: a large-scale hierarchical image database[C]//Proceedings of the IEEE Conference on Computer Vision and Pattern Recognition. Piscataway: IEEE Press, 2009: 248-255. [23] HE K, GKIOXARI G, DOLLAR P, et al. Mask R-CNN[C]//Proceedings of the IEEE/CVF International Conference on Computer Vision. Piscataway: IEEE Press, 2017: 2961-2969. [24] SAFF E B, KUIJLAARS A B J. Distributing many points on a sphere[J]. The Mathematical Intelligencer, 1997, 19(1): 5-11. doi: 10.1007/BF03024331 [25] LI D Q, JIANG T T, LIN W S, et al. Which has better visual quality: the clear blue sky or a blurry animal?[J]. IEEE Transactions on Multimedia, 2019, 21(5): 1221-1234. doi: 10.1109/TMM.2018.2875354 [26] MA X Y, WANG Y Q, LIU C, et al. ADGNet: attention discrepancy guided deep neural network for blind image quality assessment[C]//Proceedings of the 30th ACM International Conference on Multimedia. New York: ACM, 2022: 1309-1318. [27] GLOROT X, BORDES A, BENGIO Y. Deep sparse rectifier neural networks[C]//Proceedings of the 14th International Conference on Artificial Intelligence and Statistics. Ft. Lauderdale: Journal of Machine Learning Research Workshop and Conference Proceedings, 2011: 315-323. [28] HE K M, ZHANG X Y, REN S Q, et al. Deep residual learning for image recognition[C]//Proceedings of the IEEE Conference on Computer Vision and Pattern Recognition. Piscataway: IEEE Press, 2016: 770-778. [29] KINGMA D P, BA J. Adam: a method for stochastic optimization[EB/OL]. (2017-01-30)[2023-04-10]. http://arxiv.org/abs/1412.6980. [30] SRIVASTAVA N, HINTON G, KRIZHEVSKY A, et al. Dropout: a simple way to prevent neural networks from overfitting[J]. Journal of Machine Learning Research, 2014, 15: 1929-1958. [31] SUN W, GU K, MA S W, et al. A large-scale compressed 360-degree spherical image database: from subjective quality evaluation to objective model comparison[C]//Proceedings of the IEEE 20th International Workshop on Multimedia Signal Processing. Piscataway: IEEE Press, 2018: 1-6. [32] DUAN H Y, ZHAI G T, MIN X K, et al. Perceptual quality assessment of omnidirectional images[C]//Proceedings of the IEEE International Symposium on Circuits and Systems. Piscataway: IEEE Press, 2018: 1-5. [33] ITU-R. Methodology for the subjective assessment of the quality of television pictures: ITU-R BT. 500-11[S]. Geneva: International Telecommunication Union, 2002: 2-30. [34] WANG Z, BOVIK A C, SHEIKH H R, et al. Image quality assessment: from error visibility to structural similarity[J]. IEEE Transactions on Image Processing, 2004, 13(4): 600-612. doi: 10.1109/TIP.2003.819861 [35] WANG Z, SIMONCELLI E P, BOVIK A C. Multiscale structural similarity for image quality assessment[C]//The 37th Asilomar Conference on Signals, Systems & Computers. Piscataway: IEEE Press, 2003: 1398-1402. [36] MITTAL A, MOORTHY A K, BOVIK A C. No-reference image quality assessment in the spatial domain[J]. IEEE Transactions on Image Processing, 2012, 21(12): 4695-4708. doi: 10.1109/TIP.2012.2214050 [37] MITTAL A, SOUNDARARAJAN R, BOVIK A C. Making a “completely blind” image quality analyzer[J]. IEEE Signal Processing Letters, 2013, 20(3): 209-212. doi: 10.1109/LSP.2012.2227726 [38] MA K D, DUANMU Z F, WANG Z, et al. Group maximum differentiation competition: model comparison with few samples[J]. IEEE Transactions on Pattern Analysis and Machine Intelligence, 2020, 42(4): 851-864. doi: 10.1109/TPAMI.2018.2889948 [39] MA K D, WU Q B, WANG Z, et al. Group MAD competition? a new methodology to compare objective image quality models[C]//Proceedings of the IEEE Conference on Computer Vision and Pattern Recognition. Piscataway: IEEE Press, 2016: 1664-1673. [40] XUE W F, ZHANG L, MOU X Q, et al. Gradient magnitude similarity deviation: a highly efficient perceptual image quality index[J]. IEEE Transactions on Image Processing, 2014, 23(2): 684-695. doi: 10.1109/TIP.2013.2293423 [41] REDMON J, FARHADI A. YOLOv3: an incremental improvement[EB/OL]. (2018-04-08)[2023-04-10]. http://arxiv.org/abs/1804.02767. -

 下载:
下载:


 点击查看大图

计量
- 文章访问数: 337
- HTML全文浏览量: 69
- PDF下载量: 19
- 被引次数: 0
